

| NAV Price | 3 Month Return | 1 Year Return | Since Inception p.a. |
|---|---|---|---|
| $2.02 | -11.2% | 92.3% | 28.1% |
Executive Summary
Defender Global Fund (“Fund”) is a multi-strategy fund primarily focused on global long/short equities whilst reducing volatility with uncorrelated select exposures to private companies and managed funds.
Performance (after fees)
| Since Inception | |||||||
|---|---|---|---|---|---|---|---|
| 3 months | 6 months | 1 year | 2 years p.a. | 3 years p.a. | p.a. | cum. | |
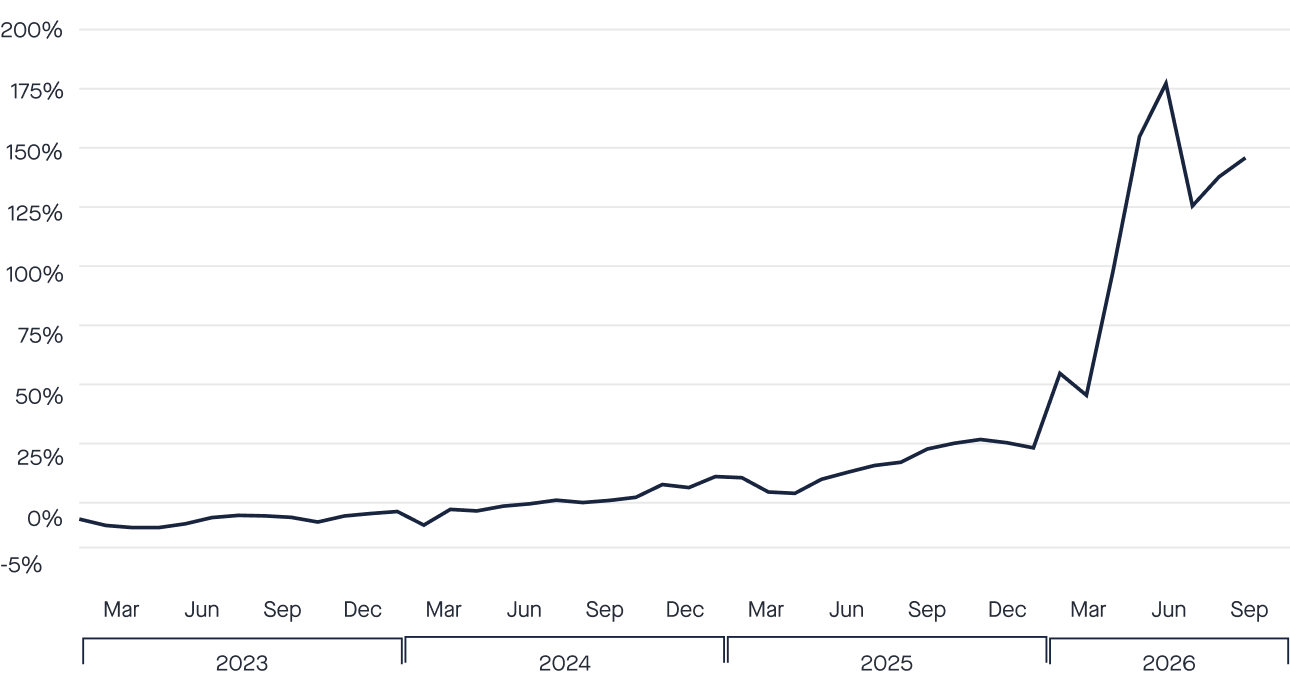
| Defender Global Fund | -11.2% | 64.1% | 92.3% | 51.7% | 35.0% | 28.1% | 147.9% |
Historical Performance (after fees)
Quarterly Returns (after fees)
| Year | Q1 | Q2 | Q3 | Q4 | CY |
|---|---|---|---|---|---|
| 2023 | -3.4% | 4.3% | 0.1% | 1.5% | 2.4% |
| 2024 | 1.6% | 2.3% | 1.3% | 4.9% | 10.4% |
| 2025 | -1.5% | 7.2% | 8.0% | 2.0% | 16.3% |
| 2026 | 14.9% | 84.7% | -11.2% | – | 88.6% |
Quarterly Attribution
Contributorsbps
Microsoft (MSFT)+83
Sandisk (SNDK)+82
Meta Platforms (META)+81
NVIDIA (NVDA)+35
Tasmea (TEA)+29
Detractorsbps
Sharon AI (SHAZ)-1,428
Space Exploration (SPCX)-16
Regal Australian Small Companies-11
Pershing Square Holdings (PSH)-10
Alphabet (GOOG)-9
Fund Facts
| StrategyMulti-Strategy |
| ObjectiveSuperior absolute returns from global markets with a focus on capital preservation |
| Investment ManagerDefender Asset Management Pty Ltd |
| Portfolio ManagerDaniel Gafforini |
| Inception1 January 2023 |
| StructureAustralian unit trust, wholesale investors only |
| Applications / RedemptionsMonthly |
| Management Fee1.00% p.a. |
| Performance Fee20%, high-water mark |
| CurrencyAUD, unhedged |
Risk Statistics (since inception)
| Annualised volatility | 28.4% |
| Sharpe ratio | 0.86 |
| Sortino ratio | 2.65 |
| Maximum drawdown | -18.0% |
| Positive months | 63.6% |
| Best month (Apr ’26) | 33.6% |
| Worst month (Jul ’26) | -18.0% |
Portfolio Composition
| % of portfolio | |
|---|---|
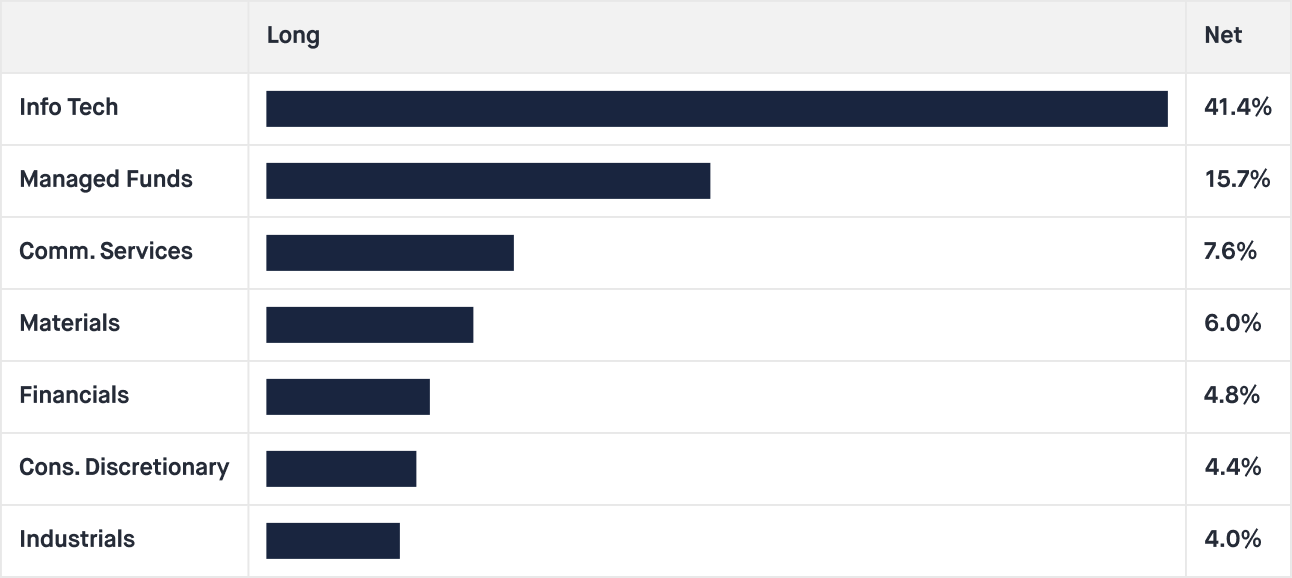
| Global Equities | 66.6% |
| Managed Funds | 15.7% |
| Private Companies | 1.6% |
| Cash | 16.1% |
Portfolio
| Long | Short | Gross | Net | Cash | Positions |
|---|---|---|---|---|---|
| 83.9% | 0.0% | 83.9% | 83.9% | 16.1% | 43 |
Sector Exposure (% of Portfolio)
Quarterly Region Exposure
Top Holdings (A-Z)
| Alphabet (GOOG) | Comms |
| Amazon.com (AMZN) | Cons Discr |
| Ellerston 2050 Fund | Funds |
| Meta Platforms (META) | Comms |
| Microsoft (MSFT) | Info Tech |
| NVIDIA (NVDA) | Info Tech |
| Oracle (ORCL) | Info Tech |
| Sandisk (SNDK) | Info Tech |
| Sharon AI (SHAZ) | Info Tech |
| Zip Co (ZIP) | Financials |
| Top 10 Total | 56.2% |
Regional Exposure (% excl cash)
| Long | Short | Net | |
|---|---|---|---|
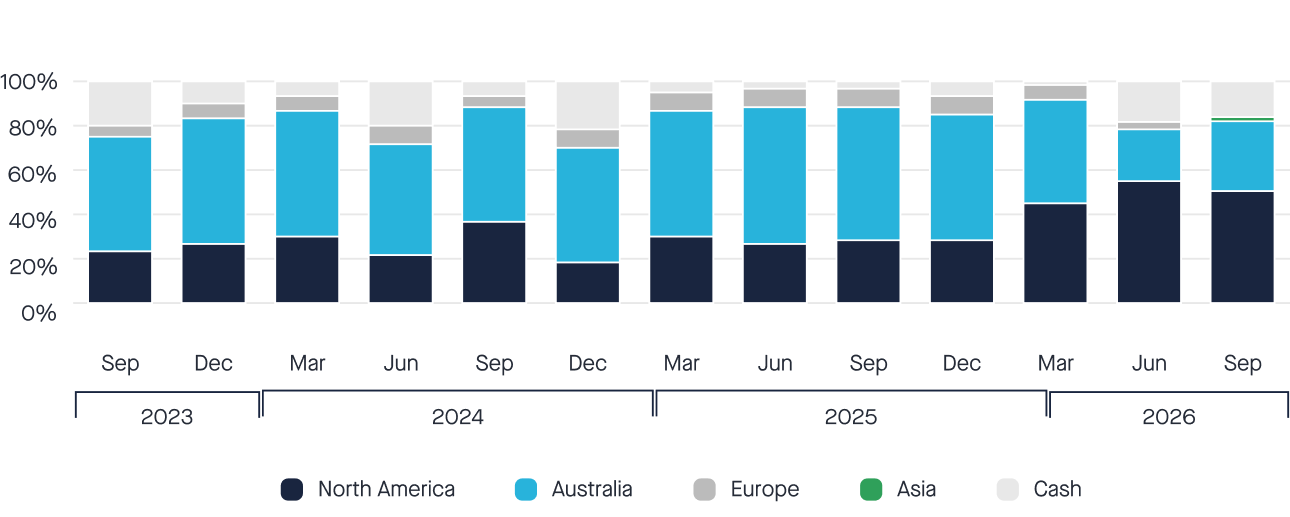
| North America | 50.5% | 0.0% | 50.5% |
| Australia | 31.5% | 0.0% | 31.5% |
| Asia | 1.9% | 0.0% | 1.9% |
Quarterly Commentary
Quarter in Review
The Defender Global Fund returned -11.2% in the September 2026 quarter, net of fees, including a +3.0% return in September. The three largest contributors for the quarter were Microsoft (MSFT), Sandisk (SNDK) and Meta Platforms (META), and the three largest detractors were SharonAI (SHAZ), Space Exploration Technologies (SPCX) and the Regal Australian Small Companies Fund. In September, Meta Platforms, SharonAI and Sandisk were the largest contributors, while the Paragon Australian Long/Short Fund, BHP Group (BHP) and Oracle (ORCL) were the largest detractors.
There has been plenty of commentary about a “two-sided” market in September. In our view, “two-sided” is doing a lot of heavy lifting when four stocks did all the hard work and the other 496 did not. Microsoft, Meta, Apple and NVIDIA rose between 14% and 38% and added roughly 300 points to the S&P 500, while the remaining 496 stocks took away about 150 points. The S&P MidCap 400 and Russell 2000 fell 6.4% and 7.3% respectively. Even within AI, the gains went to a handful of names: Alphabet, Oracle and Broadcom declined; chip equipment, memory and storage stocks sold off; and rising yields weighed on long-duration growth stocks more broadly.
Australia followed a similar pattern, albeit with a different mix of businesses. After more than a year of downgrades, CSL beat expectations on plasma sales and guided to higher margins in its Behring division. CSL’s share price rose 61% in the quarter, and without CSL the ASX 200 would have fallen about 1% rather than finishing flat. The resources-heavy Small Ordinaries Index fell 1.6%, which is comparatively positive compared to its industrials and financials-heavy US counterpart.
Of the Fund’s positions, 65% made a positive contribution in the quarter. SharonAI was the largest detractor, giving back part of a very strong June quarter in which its share price rose more than 250%.
Oil, Inflation & Bonds Dominated the Macro
The Iran ceasefire broke down in early July, and constrained shipping through the Strait of Hormuz pushed Brent crude up 42% in the September quarter. Fuel prices followed: the US average retail diesel price rose about 37%, and Australia’s national average unleaded pump price rose 16%. Inflation proved stubborn, and six central banks raised policy rates by 25bp in September: the Fed, RBA, ECB, Bank of Japan, Norges Bank and RBNZ. The pace has differed across central banks (the RBNZ hiked twice in the quarter, the Fed hiked for the first time since 2023, and the RBA delivered its fourth hike of 2026), but the direction is up as they respond to inflation in the economic data.
Once again, the bond market’s tail wagged the central bank dog. In the US, two-thirds of the quarter’s 85bp rise in 10-year yields came before the Fed hiked on 16 September. In Australia, the 10-year yield rose 68bp to 5.41% by mid-September, more than its entire quarterly gain, two weeks before the RBA hiked on 29 September. The US 10-year yield finished September at 5.29%, its highest level since 2002, while the Australian 10-year eased to 5.34%. We think central banks are close to the top of the rate cycle; however, we are now more focused on how long rates stay high, and whether they could fall faster than expected. Our conversations with numerous large retailers over the last four to eight weeks point to significant softness in consumer spending. We expect retailers to advertise early and heavily for the upcoming shopping season (Black Friday, Cyber Monday and Christmas) as they try to encourage consumers to spend in a tough trading environment.
The AI Capex Wave: Fears vs. Demand
Debate over the AI capex wave sharpened during the quarter. Some investors argue the AI bull market has reached its final stage, pointing to US 10-year yields above 5% and widening credit default swap spreads on CoreWeave and Oracle debt. Demand for compute tells a different story, though: one-year rental rates for NVIDIA’s H100 have risen around 60% over the past 12 months. In our view, that demand has built up even though most users pay little for the value they receive, which leaves the labs room to raise prices. Most consumers also still use AI at a very basic level, which should lift demand for compute as users become more sophisticated.
That sophistication is starting to change following the launch of Meta’s Muse, OpenAI’s dots and SpaceXAI’s Grok Bot in the past few months. These are always-on agents that carry out tasks on the user’s behalf. The idea is not new, since Codex, Claude Code, Hermes and OpenClaw already existed, but those tools were largely used by technical users who knew how to set them up. Muse, dots and Grok Bot make agents more mainstream and intuitive to use, which should drive more demand from here. In early July 2026, Menlo Ventures surveyed more than 5,000 US adults and found that 24% of AI users used an agent regularly. That was before the three major labs released their own user-friendly versions. For context, only 2-3% of households pay for AI themselves (an average spend of US$31 a month), even though 25% of US adults say they use it daily. To us, this implies most people use AI at work, on plans their employer pays for, and that personal use, including personal agents, has plenty of room to grow. Furthermore, heavy users spending US$100 or more a month make up 14% of paying users (about 5% of US adults) but account for 60% of consumer AI spend. We expect the labs’ new agentic tools to help unlock this share-of-wallet upside, while consumers still receive considerable value for little outlay.
Closer to Home
In August, the Fund exited its gold positions in Evolution Mining (EVN), Northern Star Resources (NST) and Genesis Minerals (GMD) as the spot gold price approached US$4,600 per ounce. By mid-September, the Fund was buying gold producers again: Ramelius Resources (RMS), ahead of the investor day at which it set out its FY27 guidance and four-year plan, and Evolution Mining. Both share prices had taken a breather and were beginning to attract buyers again as geopolitical and other risks flared up once more. In total, the Fund’s gold equities contributed 80bp in the quarter (112bp including copper exposures).
While we believe the copper thematic is real and has years to play out, the Fund halved its holding in Cobre as we felt the share price had begun to reflect a lot of future expectations. BHP’s result was positive, with copper delivering more than half of FY26 EBITDA for the first time, although iron ore still has an outsized impact on daily share price movements.
The Fund was particularly active in ZIP Co (ZIP) during the quarter. We exited the holding entirely on the day of the result, then bought a trading position after Meta’s Muse announcement raised questions about how agentic shopping may affect payment providers and the routing (or lack of routing) of payments. We have since exited ZIP and prefer to watch its next quarterly update from the sidelines.
Lastly, we redeemed several Australian unit trusts, met with new investment managers, and will continue to invest with specialist fund managers that diversify the Fund’s core equities portfolio.
Portfolio Positioning
The Fund’s AI exposure spans hyperscalers, neoclouds, memory, storage and electrical contractors. Each layer faces supply constraints against a multi-year demand backdrop, which gives us confidence that the fundamentals of each investment case still hold and offer an attractive risk/return.
The Fund ended the September quarter with 16% cash, which we expect to maintain ahead of the US midterm elections. Over the December quarter we will review a long list of stocks that sit 10-50% or more below their all-time highs. We expect some to clear our high hurdle and diversify the portfolio by theme and market capitalisation.
Outlook
The Fund enters the final quarter of 2026 against a demanding backdrop: the US 10-year yield near its highest level since 2002, the risk that central banks hold rates higher for longer, and oil volatility feeding stubborn inflation. Our view remains that the AI build-out has further to run, with supply-chain constraints appearing to extend into 2028 and possibly beyond. The market is right, however, to question how the capex pipeline will be funded and whether the economics stack up.